How to Analyze a Stock Before Investing: Basic Metrics
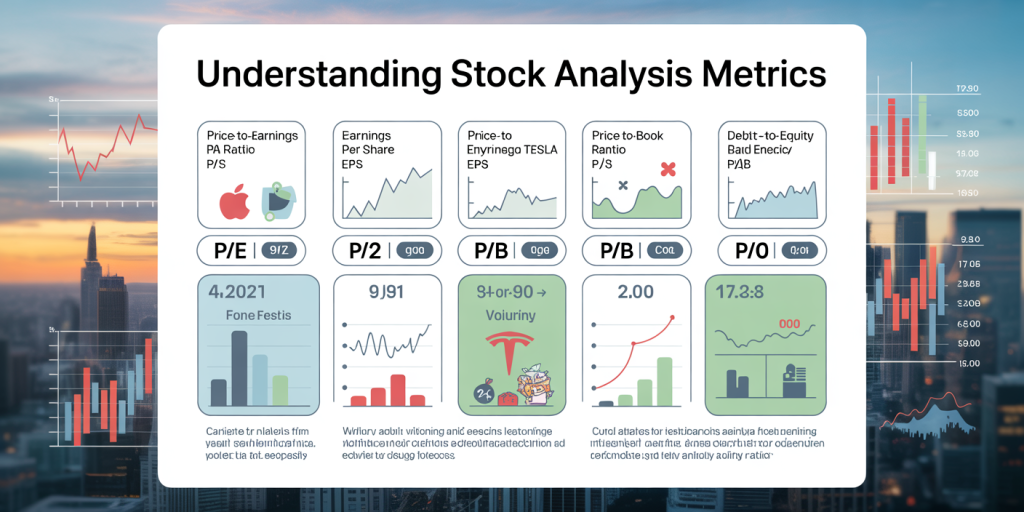
Investing in the stock market can be an effective way to grow wealth, but it requires careful analysis to make informed decisions. Many beginner investors jump into buying shares without understanding the fundamental metrics that indicate a stock’s potential for success or risk. This approach often leads to disappointment and losses. To mitigate such risks, a solid grasp of essential stock analysis metrics is crucial before committing any capital. This article will guide you through the primary metrics used to evaluate stocks, supplemented with real-world examples and practical insights.
Understanding the Importance of Stock Analysis
Before buying shares in any company, it’s vital to understand the basics of how stock performance is measured. Stock prices fluctuate due to numerous factors, including company earnings, market trends, economic conditions, and investor sentiment. However, relying solely on gut feeling or market hype can be detrimental. Instead, analyzing quantitative data provides a clearer picture of the company’s financial health and growth prospects.

For example, during the 2020 pandemic-related market selloff, many technology stocks dropped sharply but rebounded based on strong earnings reports and future outlooks. Investors who focused on fundamental metrics rather than panic selling often profited as the market recovered. Such examples underscore why knowledge of essential stock metrics is indispensable for anyone serious about investing.
Price-to-Earnings (P/E) Ratio: Assessing Valuation
Anúncios
The Price-to-Earnings ratio remains one of the most widely used metrics for stock analysis. It measures a company’s current share price relative to its earnings per share (EPS). The formula is:
> P/E Ratio = Share Price / Earnings Per Share (EPS)
A high P/E ratio may indicate that investors expect significant growth from the company, while a low P/E could suggest undervaluation or potential risks.
Consider two hypothetical companies: Company A trading at $100 per share with an EPS of $5 has a P/E of 20. Company B is priced at $50 with an EPS of $5, giving a P/E of 10. At first glance, Company B appears cheaper, but a deeper look is necessary. A lower P/E might mean that investors perceive Company B to have lower growth potential or higher risk.
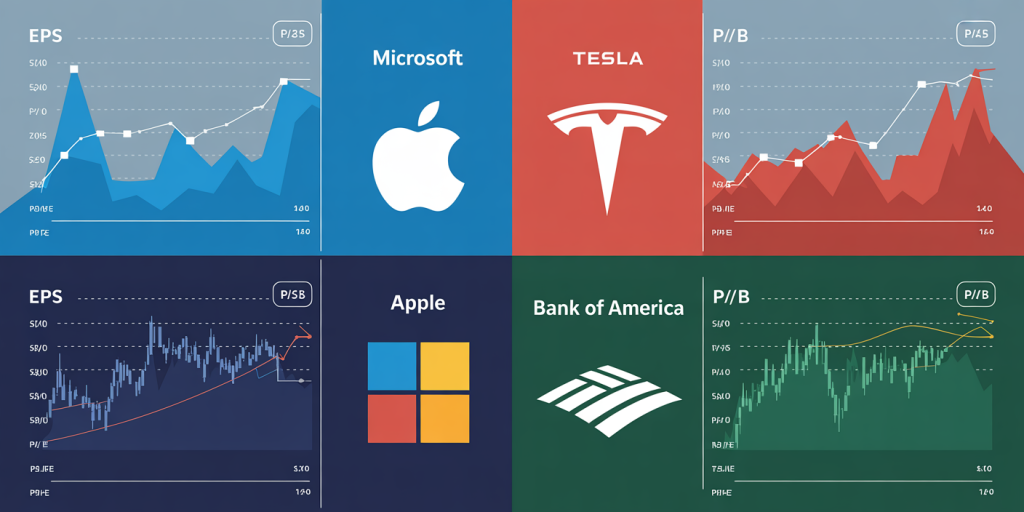
Real-world example: Apple Inc. (AAPL) consistently trades at a higher P/E ratio compared to average market levels, reflecting investors’ confidence in its innovation and profitability. According to data from 2023, Apple’s P/E ratio hovered around 27, compared to the S&P 500 average of approximately 20. This premium valuation is often justified by Apple’s steady revenue growth and strong market position.
Table 1: Comparative P/E Ratios of Select Technology Companies (2023)
Anúncios
| Company | Share Price | EPS | P/E Ratio |
|---|---|---|---|
| Apple (AAPL) | $165 | $6.11 | 27.0 |
| Microsoft (MSFT) | $310 | $9.30 | 33.3 |
| Intel (INTC) | $50 | $2.70 | 18.5 |
This comparison enables investors to prioritize investments based on how much they are paying per dollar of earnings and corresponding growth expectations.
Earnings Per Share (EPS): Understanding Profitability
EPS represents the portion of a company’s profit allocated to each outstanding share of common stock, providing insight into profitability on a per-share basis. It’s calculated by dividing net income by the weighted average number of outstanding shares:
> EPS = Net Income / Outstanding Shares
A rising EPS is generally a positive indicator, signaling increased profitability. Conversely, declining EPS figures may indicate trouble.
In 2021, Tesla (TSLA) reported a notably high EPS growth compared to previous years, partly due to increased electric vehicle production and improving margins. Its EPS jumped from $0.64 in 2020 to over $4.90 in 2021, reflecting rapid growth.
EPS must be contextualized with the company’s industry. For instance, utilities typically have lower EPS but can still be stable investments due to predictable cash flows. Meanwhile, tech companies often experience rapid EPS growth, but with more volatility.
Table 2: EPS Trends for Selected Companies (2019-2021)
| Company | 2019 EPS | 2020 EPS | 2021 EPS |
|---|---|---|---|
| Tesla (TSLA) | 0.04 | 0.64 | 4.90 |
| Amazon (AMZN) | 23.01 | 41.83 | 27.75 |
| Duke Energy (DUK) | 4.60 | 4.67 | 3.53 |
This table shows how EPS growth (or decline) varies widely across industries and business cycles.
Price-to-Book (P/B) Ratio: Measuring Asset Value
The Price-to-Book ratio compares a company’s market price to its book value (total assets minus liabilities). It is calculated as:
> P/B Ratio = Market Price per Share / Book Value per Share
A P/B ratio below 1 can indicate that the stock is undervalued relative to its assets, which could represent a buying opportunity. However, it can also signal fundamental issues with the company.
Financial institutions like banks often trade close to their book value because their assets (loans, securities) closely represent intrinsic value. On the other hand, tech firms with intangible assets typically have higher P/B ratios.
Real example: Bank of America (BAC) historically trades near a P/B of 1.2, indicating a market price close to its asset values. In contrast, Alphabet Inc. (GOOGL) consistently shows a high P/B ratio above 5 due to its high growth potential and intangible assets like intellectual property.
This ratio helps investors distinguish between companies with strong tangible asset bases and those whose value lies more in growth prospects.
Dividend Yield and Payout Ratio: Income Generation Metrics
For income-focused investors, dividend metrics are critical. The dividend yield shows the annual dividend payment as a percentage of the current stock price:
> Dividend Yield = Annual Dividends per Share / Price per Share
A high dividend yield may attract income investors, but it’s vital to ensure that dividends are sustainable.
The payout ratio indicates the proportion of earnings paid out as dividends:
> Payout Ratio = Dividends / Net Income
A payout ratio above 70-80% might indicate that dividends are at risk if earnings fall, while a moderate payout (30-50%) implies room for dividend growth.
For example, Coca-Cola (KO) is known for its steady dividend payments with a yield of approximately 3% and a payout ratio near 75%, reflecting its mature status and stable cash flow. Conversely, tech companies like Alphabet do not pay dividends, reinvesting earnings for growth instead.
Table 3: Dividend Metrics for Selected Companies (2023)
| Company | Dividend Yield | Payout Ratio |
|---|---|---|
| Coca-Cola (KO) | 3.1% | 75% |
| ExxonMobil (XOM) | 3.5% | 55% |
| Apple (AAPL) | 0.6% | 20% |
This highlights how dividend metrics vary by sector and investment strategy.
Debt-to-Equity Ratio: Evaluating Financial Leverage
The Debt-to-Equity (D/E) ratio measures a company’s financial leverage, calculated as:
> D/E Ratio = Total Liabilities / Shareholders’ Equity
A high D/E ratio suggests that a company relies heavily on borrowed funds, which can increase risk, especially in volatile markets. Conversely, a low ratio indicates conservative financing.
Consider Ford Motor Company, which traditionally operates with a higher D/E ratio around 4 to finance capital-intensive manufacturing operations. In contrast, technology companies like Microsoft maintain low debt levels, with D/E ratios below 1.
Investors use this metric to gauge the risk of insolvency and the cost structure of financing.
Future Perspectives: Integrating Metrics with Market Trends
As financial markets evolve, the way investors analyze stocks also changes. In addition to traditional metrics discussed above, integrating data analytics, environmental, social, and governance (ESG) factors, and technological innovations is increasingly essential. For example, companies with strong ESG ratings may attract premium valuations due to growing investor consciousness around sustainability.

Moreover, advancements in artificial intelligence and machine learning enable the processing of vast data sets, improving stock forecasting capabilities. However, fundamental metrics remain foundational to understanding the intrinsic value of investments.
With ongoing market developments, investors should not rely on single metrics but combine them for a holistic view. For instance, during high inflation cycles, companies with robust pricing power reflected in rising EPS and low debt levels may outperform those with weaker fundamentals.
Investing in stocks also demands continuous learning and adaptation. Market conditions change rapidly, and successful investors progressively refine their analysis techniques incorporating new data types and economic realities.
—
By mastering basic metrics such as P/E ratio, EPS, dividend yield, and debt-to-equity ratio, investors develop a robust framework for analyzing stocks before investing. Coupling these with real-world examples, sector considerations, and future market trends further enhances decision-making accuracy. Ultimately, informed stock analysis promotes disciplined investing and mitigates risks inherent to the volatile stock market, paving the way for long-term financial growth.

